DOES STAR RATING MATTER?: YELP DATA ANALYSIS
# Analyzing Yelp! Star Ratings: What Influences Them? Why do some businesses get better or worse star ratings on Yelp.com? Is there more than simply the objective customer experience that goes into ...

By Tom Snyder
Published on January 2, 2022
Analyzing Yelp! Star Ratings: What Influences Them?
Why do some businesses get better or worse star ratings on Yelp.com?
Is there more than simply the objective customer experience that goes into this star rating?
Is there a relation between star rating and particular features? The Yelp! data set may provide some insights here. The specific questions I set out to answer are:
- Identify if particular cities/states tend to have higher or lower star ratings
- Identify if star rating is related to review count
- Identify rating trends for cafes
About the Data Set

The Yelp! data set sample is an open data set provided by yelp.com. It includes 160,585 business listings with 14 different features.
Features:
- business ID
- name
- address
- city
- state
- postal code
- latitude
- longitude
- stars
- review count
- is open
- attributes
- categories
- hours
The 'attributes' and 'categories' features are lists nested within a single feature. The 'attributes' feature contains information such as whether a location has free Wi-Fi or is kid-friendly. The 'categories' feature contains information about the business classification such as if a business is a deli or hair salon. Both of these lists contain valuable information; however, this analysis is focused on the details of the business, not the location, so the 'attributes' feature was not considered in the analysis.
Data Summary
Exploratory data analysis reveals the following findings:
- Count of businesses = 160,585
- Cities represented = 836
- Average star rating = 3.65
- Median star rating = 4.0
- Average review count = 52
- Median review count = 17
Do Correlations Exist?
Using Python and Jupyter Notebook, I'm able to analyze the numerical features of the data set to identify correlations. That being said, there existed no significant correlation between any of the data set's features.
Regarding the following correlation heat map: correlation is measured on a scale of -1 to 1. A correlation of -1 means that two variables are completely opposed, a positive 1 means two variables are completely tied together, and 0 means there are no observable relationships. The heat map below shows that the variables we can measure are extremely close to 0.

Key Findings
The city most commonly represented in the data set is Austin, TX, though the state with the most representation is Massachusetts. However, although Austin has the highest volume of businesses, it does not have the highest average star rating when compared to the other cities in the list. That title belongs to Portland, OR, with an average star rating over 3.9. Does this mean that Portland has fewer but better businesses than Austin?

Additionally, the next logical question is which city has the highest average star rating overall. However, this is difficult to objectively discern because the vast difference in volume skews the data. For instance, there are a handful of cities with an average star rating of 5.0. However, these cities might have only one or two businesses reviewed due to either being a misspelling in the city name or simply a very small city, so we cannot accurately draw conclusions. The same is true for the opposite end of the spectrum, i.e., the one-star listings.
Cities with the Highest and Lowest Average Star Rating

When it comes to differences in review count, one cannot simply examine the cities, states, or even businesses with the most reviews. Because each business has its own review count, it would be judicious to investigate aggregate review counts as well. So, which state has businesses with the most reviews on average?

As it turns out, Illinois has the highest median review count per business by far with 84.2 reviews. The next highest state is Virginia with 62.7. Almost all other states have a median review count of 30 or fewer. Does this mean that people who live in Illinois and Virginia simply use Yelp! more often? Why could this be? Do they prefer Yelp! to Google or Facebook reviews? Or perhaps businesses in these states value Yelp! reviews more and push customers to the platform. One other possible conclusion could be that the business landscape in these states is more static than others, i.e., old businesses stay open longer and there are fewer new businesses opening. This business continuity gives businesses time to build up reviews over a longer timespan.
Top Takeaways
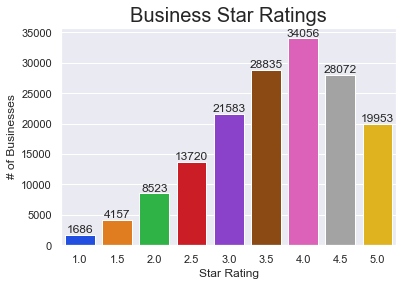
Yelp! star ratings follow a primarily normalized distribution around a 4.0 rating.

This could signify that most businesses are good, though not stellar. They are good enough to stay in business and satisfy customers long enough to gather reviews and ratings; however, reviewers still maintain their coveted 5.0 rating for only the businesses they deem truly deserving. On the other end of the spectrum, there are very few businesses with less than a 2.5-star rating. This finding is intuitive as we would not expect poor businesses to stay open long; thus, there is likely much more turnover at this end of the rating system. One question I was unable to answer with the data provided was the age of the businesses. Digging into this, we might find that businesses at the middle of the spectrum are older than those at the lower end. However, this is conjecture.
What Categories Are Most Represented?
Most businesses on Yelp fall into these categories: Beauty Spas, Health Medical, and Local Services.

As visualized in the word cloud above, 'beauty spas' is obviously a popular business category. We can also see that 'health medical', 'local services', 'event planning', and 'real estate' are also common. It surprised me that 'restaurant' wasn't one of the most popular categories.
Cafe Analysis
What State Has the Best Coffee Shops?
Oregon and Washington rate very high in average star ratings for the businesses categorized as 'cafe' or 'coffee & tea' on Yelp!

As one might assume, Oregon and Washington rate very high in average star ratings for the businesses categorized as 'cafe' or 'coffee & tea.' Two additional highly-rated states are Texas and Colorado. Notice how Massachusetts has the lowest average cafe star rating; however, they also had the highest number of businesses represented in this data set. Considering the normal curve of star rating for businesses, one might assume that Massachusetts doesn't necessarily have bad cafes, but simply that it has residents that are more avid users of Yelp! This lower rating could simply be a matter of more cafes represented than any other state. As it turns out, this is indeed the case!

Conclusion
Yelp! has an excellent database, but it is also limited. However, we can still gain useful insights from analyzing the data. Thank you for reading!
ENJOYED THIS POST? SHARE IT WITH YOUR FRIENDS! 🚀